Living draft. This chapter reflects the sources cited below and will be revised as further sources are incorporated. Found an error? Use the Report an issue link in the sidebar.
The two chapters on the indices describe each one in detail. This chapter collects what applies to both and is easy to miss when each is read alone. Its argument fits in one sentence: a composite threshold is a property of a whole configuration, and every part of that configuration has been shown to move it. For the software side of the argument, see Pipeline dependence.
15.1 The equation is the measure
A composite score is defined by its published coefficients. Anyone can implement the equation from the paper, which is what keeps the AVQI and the ABI algorithm-defined measures rather than model-derived ones in this reference’s compatibility rule (see Pipeline dependence). The corollary is that the version of the equation is part of the measure.
Versions are different measures. AVQI versions 02.02 and 03.01 differ in the length of the continuous-speech part, 17 against 34 syllables in Dutch, and in the regression weighting (Barsties and Maryn 2016). Across the studies pooled in the AVQI meta-analysis, the mean threshold was 3.05 (± 0.22) for version 02 and 2.22 (± 0.52) for version 03 (Thirunavukkarasu Jayakumar and Benoy 2024). A version 02.02 threshold, such as the Japanese 3.15 (Hosokawa et al. 2017), cannot be compared with a version 03.01 one.
Version labels do not reliably identify the equation. A technical note labels the development study’s equation version 2.03, and says the later Praat-only equation was cited both as 02.02 and as 2.06 (Zainaee et al., n.d.). Its own authors had reported version 2.06 in a Persian validation but had used 2.03 (Zainaee et al., n.d.). A second Persian validation, by a different group, reports AVQI 03.01 computed in VOXplot, but the equation it prints is the development study’s, with its ×2.571 rescaling (Aghajanzadeh et al. 2025; Maryn et al. 2010). The paper does not let a reader tell whether the equation or the version label is the error.
Printed equations differ. Two validations misprint the AVQI 03.01 HNR term, and one also the Tilt coefficient; two print the ABI intercept with a different digit string. The AVQI and ABI chapters tabulate these and say which reading this reference follows. The practical rule is the one those chapters give: take the coefficients from the script the developers published, not from an equation retyped in a later paper.
15.2 What moves a threshold
There is no single threshold for either index. A threshold belongs to an index version, a language and its speech material, a reference standard, a derivation criterion, a sample and a software pipeline. Each of these has been shown to move it.
Table 15.1: What moves a composite threshold. One documented case per factor. This is a map of what moves a threshold, not a table of cutoffs; the cutoffs, with their Pipeline and Class cells, are in the AVQI and ABI chapters.
AVQI 03.01 from 1.16 to 2.43; ABI from 2.35 to 3.69, across the language validations
Englert et al. (2020); Castillo-Allendes et al. (2023); Barsties and Maryn (2016); Barsties v. Latoszek et al. (2021)
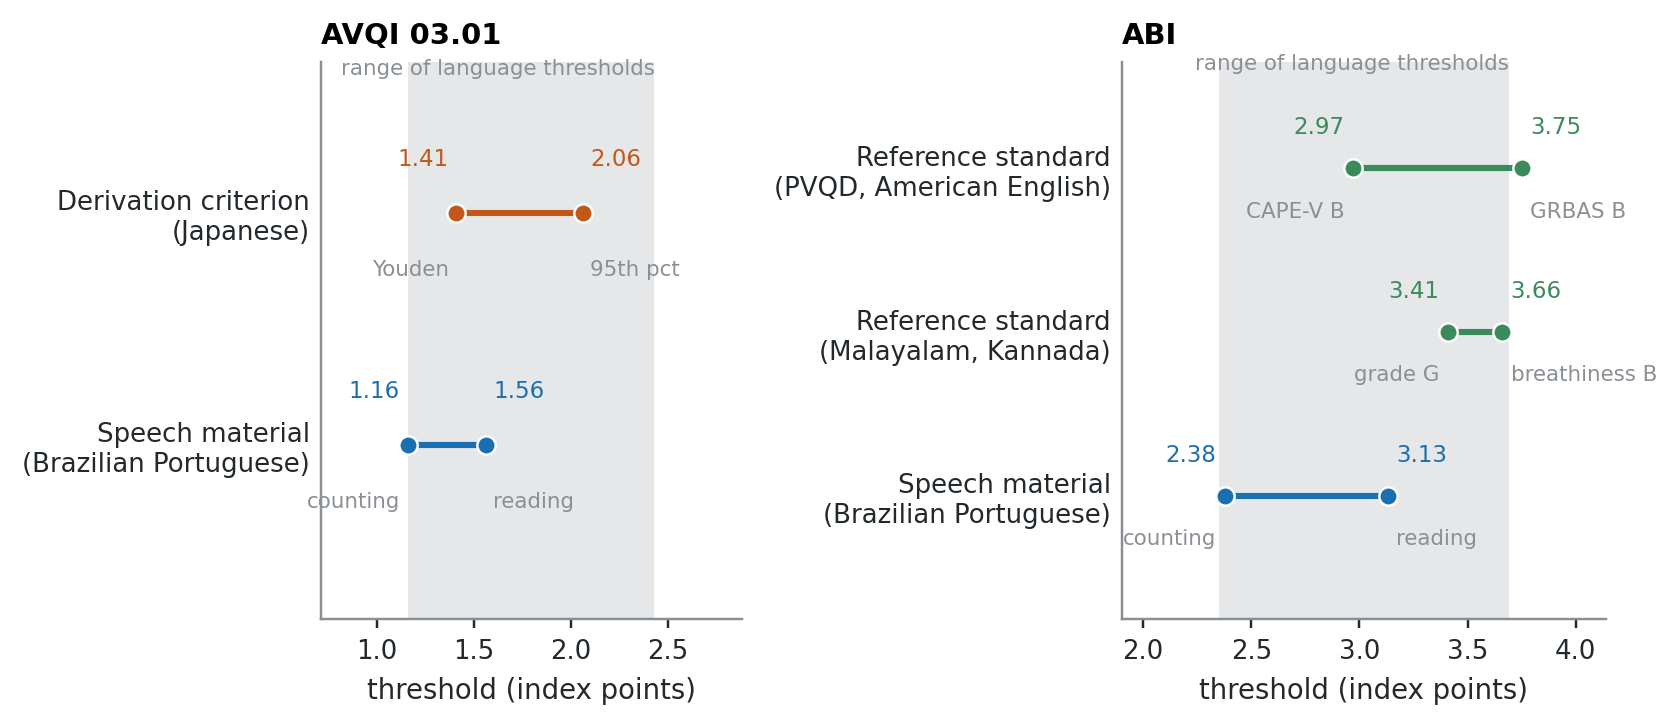
The rows marked “yes” isolate one factor each, and they are the informative ones. The language row does not isolate anything: every pair of language validations also differs in sample, reference standard, derivation criterion and usually software. The spread across languages therefore cannot be read as an effect of language alone.
Show the code for this figure
panels = [ ("AVQI 03.01", (1.16, 2.43), [ ("Derivation criterion\n(Japanese)", 1.41, 2.06, "Youden", "95th pct", vs.ORANGE), ("Speech material\n(Brazilian Portuguese)", 1.16, 1.56, "counting", "reading", vs.BLUE), ]), ("ABI", (2.35, 3.69), [ ("Reference standard\n(PVQD, American English)", 2.97, 3.75, "CAPE-V B", "GRBAS B", vs.GREEN), ("Reference standard\n(Malayalam, Kannada)", 3.41, 3.66, "grade G", "breathiness B", vs.GREEN), ("Speech material\n(Brazilian Portuguese)", 2.38, 3.13, "counting", "reading", vs.BLUE), ]),]fig, axes = plt.subplots(1, 2, figsize=(7.6, 3.4), gridspec_kw={"width_ratios": [1, 1.15]})for ax, (title, band, rows) inzip(axes, panels): ax.axvspan(*band, color=vs.GRID, alpha=0.9, zorder=0, lw=0)for i, (label, a, b, la, lb, c) inenumerate(rows): y =len(rows) -1- i ax.plot([a, b], [y, y], color=c, lw=2.0, zorder=2, solid_capstyle="butt")for x, lab, ha, dx in ((a, la, "right", -0.04), (b, lb, "left", 0.04)): ax.plot([x], [y], "o", ms=6, color=c, markeredgecolor="white", markeredgewidth=0.8, zorder=3) ax.text(x + dx, y +0.18, f"{x:.2f}", color=c, fontsize=7.5, ha=ha, va="bottom") ax.text(x + dx, y -0.2, lab, color=vs.MUTED, fontsize=7, ha=ha, va="top") ax.set_yticks(range(len(rows)), [r[0] for r in rows][::-1]) ax.set_ylim(-0.75, len(rows) -0.35) lo, hi = band ax.set_xlim(lo -0.45, hi +0.45) ax.set_xlabel("threshold (index points)") ax.set_title(title) ax.text(hi, len(rows) -0.42, "range of language thresholds", color=vs.MUTED, fontsize=7, ha="right", va="bottom") vs.style_axes(ax, grid=False) ax.tick_params(axis="y", length=0)fig.tight_layout()
Figure 15.1: Threshold shifts when one factor changes and the sample stays the same. Each line joins two thresholds reported by one study on one sample. Left: AVQI 03.01, where changing only the derivation criterion (Japanese, Hosokawa, Barsties v. Latoszek, et al. (2019)) moves the threshold further than changing the speech material does (Brazilian Portuguese, Englert et al. (2020)). Right: ABI, where changing the speech material (Englert et al. (2020)) or the perceptual reference standard (T. Jayakumar and Benoy (2024); Lucero (2026)) moves it by up to 0.78 points. The grey band behind each panel is the range of thresholds across the published language validations of that index; the PVQD values are exploratory candidates, not a validation, which is why one lies outside it. The Japanese shift alone covers half the AVQI band. These are paired study values, not cutoffs.
Pooled values are not cutoffs. The ABI meta-analysis derived a weighted threshold of 3.40 across six studies, with pooled sensitivity highly heterogeneous (I2 = 89.7%) (Barsties v. Latoszek et al. 2021). Pooled AVQI version 03 sensitivity was even more heterogeneous (I2 = 95.3%) (Thirunavukkarasu Jayakumar and Benoy 2024). A pooled threshold averages over exactly the factors in Table 15.1. This reference reports such values as context and never as a cutoff.
15.3 What “validated” means
Development figures overstate accuracy. The 60-sample study that produced the AVQI 03.01 weighting reports, at a threshold of 2.43, a sensitivity of 1.00 and a specificity of 0.936 (Barsties and Maryn 2015, 2016). That threshold was evaluated on the same samples that fitted the weights. On 1058 new samples the same threshold gave a sensitivity of 0.785 and a specificity of 0.932 (Barsties and Maryn 2016). A perfect sensitivity in a development sample is a sign of where the number came from, not of how the index will perform. The candidate cutoffs in the PhonaLab study of the PVQD were checked against this by repeated ten-fold cross-validation, with AUC optimism of 0.002 or less (Lucero 2026).
External validation, as the developers defined it.Barsties and Maryn (2016) define external validity as the ability to reproduce results with alternative subjects and in settings outside the initial study, and tested the AVQI on a completely new and independent set of voices and judges. The later studies are of a different kind. They validate the indices in new languages and derive a new threshold in each (Barsties v. Latoszek et al. 2021, 2020). A threshold re-derived in a new sample is a new estimate, not a replication of the old one.
How independent the evidence is. Of the thirteen development and language-validation studies in Table 15.2, ten include an index developer, Barsties v. Latoszek or Maryn, among their authors. The exploratory PVQD candidates are not a validation and are not counted; their author developed PhonaLab (Lucero 2026).
Table 15.2: Developer authorship of the AVQI and ABI validations in this reference’s sources, from the papers’ author lines.
One corpus of 218 German recordings underlies the German validation, the Praat-versions study and the VOXplot single-measure study (Stappenbeck et al. 2020; Barsties v. Latoszek et al. 2023). The ABI meta-analysis counts among its authors the first authors of five of the six studies it pools (Barsties v. Latoszek et al. 2021). None of this makes a result wrong, and developer involvement is how a protocol gets followed faithfully in a new language. It does mean that agreement among these studies is weaker evidence than the number of studies suggests.
Base rates. The Dutch external validation sample was 8% normophonic and 92% dysphonic. The authors used likelihood ratios because they are less vulnerable to such base-rate differences than ROC statistics alone (Barsties and Maryn 2016). Sensitivity and specificity from a sample that skewed are a poor guide to a clinic’s own mix.
15.4 How the indices relate
Shared construction. Both indices are computed on voiced segments of continuous speech, extracted automatically and concatenated with a sustained vowel (Barsties and Maryn 2016; Barsties v. Latoszek et al. 2021). Both depend on a balance between the two speech types: the AVQI 03.01 weighting was built for it (Barsties and Maryn 2015), and the ABI meta-analysis treated unequal proportions as a risk of bias (Barsties v. Latoszek et al. 2021).
Shared components, different targets. Three of the six AVQI measures are also ABI measures: CPPS, shimmer local and shimmer local dB (Barsties and Maryn 2016; Delgado Hernández et al. 2018). In the AVQI, CPPS is the main factor (Barsties and Maryn 2016). But the AVQI estimates overall voice quality, judged as GRBAS grade (Barsties and Maryn 2016), and the ABI estimates breathiness and suits voices dominated by it (Barsties v. Latoszek et al. 2021). The two scores are not interchangeable, and neither is a substitute for the other.
What a composite adds over its best component. In the PVQD, the ABI outperformed HNR for breathiness on a DeLong test, but not CPPS: AUC 0.862 against 0.843, P = 0.209 (Lucero 2026). In the developers’ pooled comparison of indices, AVQI 03.01 had the highest concurrent validity with perceived overall voice quality, weighted r = 0.821, against 0.524 for the Dysphonia Severity Index and 0.788 and 0.748 for the Cepstral Spectral Index of Dysphonia on vowels and on speech (Barsties and Maryn 2016). Whether a composite earns its extra measures over CPPS alone is a question to ask of each sample, not a settled fact. The DSI has no chapter of its own yet, because its development paper is not among this reference’s sources.
15.5 Software and recording
Praat versions. One Praat version, 6.0.46, carries a CPPS bug that cut sensitivity at the German thresholds to 23% for the AVQI and 9% for the ABI, while correlations with perceptual ratings stayed intact (Stappenbeck et al. 2020). The details are in Pipeline dependence.
Sampling rate. The French AVQI validation recorded at 11,025 Hz (Pommée et al. 2020), while the AVQI script computes spectral slope and tilt over bands reaching 10 kHz (Barsties and Maryn 2016). See the AVQI chapter.
15.6 Reading or reporting a composite score
Every factor in Table 15.1 has to be known before a score can be compared with a threshold. A report of an AVQI or ABI score should therefore state:
the index and its version, and where the equation was taken from;
the software and its version, and the script version where there is one;
the language, the speech material and the number of syllables of continuous speech;
for any threshold applied: the study it comes from, its reference standard and its derivation criterion.
A threshold whose study differs from the measurement on any of these is not a cutoff for that measurement. This list is this reference’s recommendation, drawn from the sources above, not a published standard.
15.7 Where the sources disagree
Are the indices robust across languages?Delgado Hernández et al. (2018) found the Spanish AVQI threshold close to the Dutch and Japanese ones and suggested that the AVQI may be relatively insulated from inter-language phonetic differences. The ABI meta-analysis found the ABI relatively robust to phonetic differences such as stress timing, syllable timing and intonation (Barsties v. Latoszek et al. 2021). Later validations widened the ranges to 1.16–2.43 for the AVQI 03.01 and 2.35–3.69 for the ABI (Englert et al. 2020; Castillo-Allendes et al. 2023; Barsties and Maryn 2016; Barsties v. Latoszek et al. 2021). Those validations also differ in speech material, reference standard, derivation criterion and software, each of which moves a threshold on its own. Whether the remaining spread reflects language is therefore not established. This is this reference’s reading of the sources together.
Which Japanese threshold.Hosokawa, Barsties v. Latoszek, et al. (2019) computed 1.41 by the Youden index and 2.06 by the 95th percentile of controls, and recommend 2.06. Most other language rows are Youden-derived, so the Japanese row reflects a different criterion as well as a different language. The AVQI chapter keeps 2.06 and flags it.
Aghajanzadeh, Mahshid, Saeed Saeedi, Shohreh Jalaie, Kiarash Esarian, and Ben Barsties v. Latoszek. 2025. “Validation of the AcousticVoiceQualityIndex and the AcousticBreathinessIndex in the Persian Language.”Journal of Voice 39 (6): 1700.e9–15. https://doi.org/10.1016/j.jvoice.2023.07.002.
Barsties, Ben, and Youri Maryn. 2015. “The Improvement of Internal Consistency of the AcousticVoiceQualityIndex.”American Journal of Otolaryngology 36: 647–56. https://doi.org/10.1016/j.amjoto.2015.04.012.
Barsties, Ben, and Youri Maryn. 2016. “External Validation of the AcousticVoiceQualityIndex Version 03.01 with Extended Representativity.”Annals of Otology, Rhinology & Laryngology 125 (7): 571–83. https://doi.org/10.1177/0003489416636131.
Barsties v. Latoszek, Ben, Geun-Hyo Kim, Jonathan Delgado Hernández, et al. 2021. “The Validity of the AcousticBreathinessIndex in the Evaluation of Breathy Voice Quality: A Meta-Analysis.”Clinical Otolaryngology 46 (1): 31–40. https://doi.org/10.1111/coa.13629.
Barsties v. Latoszek, Ben, Bernhard Lehnert, and Ben Janotte. 2020. “Validation of the AcousticVoiceQualityIndex Version 03.01 and AcousticBreathinessIndex in German.”Journal of Voice 34 (1): 157.e17–25. https://doi.org/10.1016/j.jvoice.2018.07.026.
Barsties v. Latoszek, Ben, Youri Maryn, Ellen Gerrits, and Marc De Bodt. 2017. “The AcousticBreathinessIndex (ABI): A Multivariate Acoustic Model for Breathiness.”Journal of Voice 31 (4): 511.e11–27. https://doi.org/10.1016/j.jvoice.2016.11.017.
Barsties v. Latoszek, Ben, Jörg Mayer, Christopher R. Watts, and Bernhard Lehnert. 2023. “Advances in Clinical Voice Quality Analysis with VOXplot.”Journal of Clinical Medicine 12 (14): 4644. https://doi.org/10.3390/jcm12144644.
Castillo-Allendes, Adrián, Juliana Codino, Lady Catherine Cantor-Cutiva, et al. 2023. “Clinical Utility and Validation of the AcousticVoiceQuality and AcousticBreathiness Indexes for Voice Disorder Assessment in English Speakers.”Journal of Clinical Medicine 12 (24): 7679. https://doi.org/10.3390/jcm12247679.
Delgado Hernández, Jonathan, Nieves M. León Gómez, Alejandra Jiménez, Laura M. Izquierdo, and Ben Barsties v. Latoszek. 2018. “Validation of the AcousticVoiceQualityIndex Version 03.01 and the AcousticBreathinessIndex in the Spanish Language.”Annals of Otology, Rhinology & Laryngology 127 (5): 317–26. https://doi.org/10.1177/0003489418761096.
Englert, Marina, Ben Barsties v. Latoszek, Youri Maryn, and Mara Behlau. 2021. “Validation of the AcousticVoiceQualityIndex, Version 03.01, to the BrazilianPortuguese Language.”Journal of Voice 35 (1): 160.e15–21. https://doi.org/10.1016/j.jvoice.2019.07.024.
Englert, Marina, Livia Lima, and Mara Behlau. 2020. “AcousticVoiceQualityIndex and AcousticBreathinessIndex: Analysis with Different Speech Material in the BrazilianPortuguese.”Journal of Voice 34 (5): 810.e11–17. https://doi.org/10.1016/j.jvoice.2019.03.015.
Hosokawa, Kiyohito, Ben Barsties, Toshihiko Iwahashi, et al. 2017. “Validation of the AcousticVoiceQualityIndex in the Japanese Language.”Journal of Voice 31 (2): 260.e1–9. https://doi.org/10.1016/j.jvoice.2016.05.010.
Hosokawa, Kiyohito, Ben Barsties v. Latoszek, Toshihiko Iwahashi, et al. 2019. “The AcousticVoiceQualityIndex Version 03.01 for the Japanese-Speaking Population.”Journal of Voice 33 (1): 125.e1–12. https://doi.org/10.1016/j.jvoice.2017.10.003.
Hosokawa, Kiyohito, Ben Barsties von Latoszek, Carlos Ariel Ferrer-Riesgo, et al. 2019. “Acoustic BreathinessIndex for the Japanese-Speaking Population: Validation Study and Exploration of Affecting Factors.”Journal of Speech, Language, and Hearing Research 62 (8): 2617–31. https://doi.org/10.1044/2019_JSLHR-S-19-0077.
Jayakumar, T., and Jesnu Jose Benoy. 2024. “Validation of AcousticBreathinessIndex (ABI) in the SouthIndian Population.”Journal of Voice 38 (6): 1528.e1–9. https://doi.org/10.1016/j.jvoice.2022.05.006.
Jayakumar, Thirunavukkarasu, and Jesnu Jose Benoy. 2024. “AcousticVoiceQualityIndex (AVQI) in the Measurement of Voice Quality: A Systematic Review and Meta-Analysis.”Journal of Voice 38 (5): 1055–69. https://doi.org/10.1016/j.jvoice.2022.03.018.
Kankare, Elina, and Anne-Maria Laukkanen. 2023. “Validation of the AcousticBreathinessIndex in Speakers of Finnish Language.”Journal of Clinical Medicine 12 (24): 7607. https://doi.org/10.3390/jcm12247607.
Lucero, Jorge C. 2026. “Algorithm Verification and Concurrent Validity of a Web-Based Platform for Multiparametric Acoustic Voice Quality Indices.”Journal of Voice, ahead of print. https://doi.org/10.1016/j.jvoice.2026.04.009.
Maryn, Youri, Paul Corthals, Paul Van Cauwenberge, Nelson Roy, and Marc De Bodt. 2010. “Toward Improved Ecological Validity in the Acoustic Measurement of Overall Voice Quality: Combining Continuous Speech and Sustained Vowels.”Journal of Voice 24 (5): 540–55. https://doi.org/10.1016/j.jvoice.2008.12.014.
Pommée, Timothy, Youri Maryn, Camille Finck, and Dominique Morsomme. 2020. “Validation of the AcousticVoiceQualityIndex, Version 03.01, in French.”Journal of Voice 34 (4): 646.e11–26. https://doi.org/10.1016/j.jvoice.2018.12.008.
Stappenbeck, Lydia, Ben Barsties v. Latoszek, Ben Janotte, and Bernhard Lehnert. 2020. “AcousticVoiceQualityIndex and AcousticBreathinessIndex as Two Examples for Strengths and Weaknesses of Free Software in Medicine.”Biomedical Signal Processing and Control 59: 101938. https://doi.org/10.1016/j.bspc.2020.101938.
Zainaee, Shahryar, Hamide Ghaemi, Ehsan Khadivi, et al. n.d. Technical Note: Clarification on the Acoustic Voice Quality Index Version Used in Zainaee Et Al. (2022). Zenodo.