12  Spectral Tilt

Note

Living draft. This chapter reflects the sources cited below and will be revised as further sources are incorporated. Found an error? Use the Report an issue link in the sidebar.

Warning

This first version covers H1–H2 only. The other spectral-balance measures planned for this chapter, H1–A1, H1–A3 and spectral slope, will be added when their primary sources, including formant-corrected methods, are in the source library. The LTAS slope and tilt used in the AVQI are described in the AVQI chapter.

12.1 What spectral tilt measures

Many acoustic measures describe how a voice’s energy is distributed across the spectrum. One family compares the amplitude of the first harmonic with a later harmonic or a formant: H1 against H2 gives H1–H2, and H1 against the first or third formant gives H1–A1 and H1–A3 (Kreiman and Sidtis 2011). What they share is the observation that weakness and breathiness go with less high-frequency energy in the voice (Kreiman and Sidtis 2011).

12.2 H1–H2

12.2.1 Definition

H1–H2 is the difference in amplitude between the first harmonic (H1) and the second harmonic (H2) of the voice spectrum, in decibels (Kreiman and Sidtis 2011; Toles and Murton 2025). It indirectly measures the relative length of the open phase of glottal oscillation (Barsties v. Latoszek et al. 2018; Delgado Hernández et al. 2018). In breathy voices the first harmonic is relatively strong compared with the weaker harmonics that follow it (Barsties v. Latoszek et al. 2018; Delgado Hernández et al. 2018), so increasing weakness or breathiness generally raises H1–H2 (Kreiman and Sidtis 2011). Lower values are taken to reflect greater glottal closure, and higher values less vocal fold adduction (Toles and Murton 2025). That reading is an assumption in the literature, and the evidence below tests it.

H1–H2 is also one of the nine components of the Acoustic Breathiness Index (Barsties v. Latoszek et al. 2017).

12.2.2 How it is computed

The formula is trivial:

\[ \text{H1–H2} = A(\text{H1}) - A(\text{H2}) \quad \text{[dB]} \]

Everything that makes two H1–H2 values comparable lies outside it: how the first harmonic is found, which spectrum its amplitude is read from, over what stretch of signal, and whether the harmonic amplitudes are corrected for the formants of the vowel. The sources in this reference compute it in at least three different ways, and they are not interchangeable.

Table 12.1: Implementations of H1–H2 in the sources of this chapter.
Implementation Harmonic location Spectrum Averaging Formant correction Stated in full?
ABI script (Barsties v. Latoszek et al. 2017) F0 from the cepstral peak (60–400 Hz search); H1 = spectral maximum within ±20 Hz of it; H2 within ±20 Hz of twice that frequency LTAS of each window, 6-Hz bandwidth consecutive 0.1-s windows of the concatenated speech-and-vowel signal, then the mean none yes
PhonaLab (Lucero 2026) computed as one of the ABI components — — — engine stated: Parselmouth 0.4.7 (Praat 6.1.38)
Toles laboratory (Toles and Murton 2025; Toles et al. 2026) not stated not stated not stated not stated no: a custom script (“Phonanium CommV”)
Fröhlich et al. (Fröhlich et al. 2000) two forms: a peak-level and a regional-level difference short-time power spectrum not stated here not stated here partly

Two details of the ABI script deserve attention. Its own comment says the signal is cut into 0.05-s portions, but the code sets the window to 0.1 s, and the code is what runs. And it reads H1 and H2 from the uncorrected spectrum: there is no step that compensates for a formant lying near either harmonic.

Toles and Murton note that H1–H2 is missing from commercial packages such as ADSV, and that it can be computed in Praat (Toles and Murton 2025).

12.2.3 Reference values

Important

No reference value for H1–H2 exists in the sources of this reference. There is no normative range for typical voices, on sustained vowels or connected speech, and no diagnostic cutoff.

Table 12.2: H1–H2 reference values: declared absence.
Population Task Value Pipeline Class
Adults with typical voice Sustained vowel No published reference in the sources reviewed — —
Adults with typical voice Connected speech No published reference in the sources reviewed — —
Voice disorder vs. typical voice Any No published cutoff in the sources reviewed — —

The only typical-voice means available come from a study of simulated phonation types in healthy speakers, computed with a script whose method is not stated (Toles and Murton 2025). They appear in Figure 12.1 and under Confounds and cautions as descriptive values, classed unclassified (pipeline not stated). They are not a normal range. The correlations, odds ratios and AUCs reported below are performance metrics, not reference values.

12.2.4 What it captures

Breathiness, on sustained vowels. In the 2018 meta-analysis of acoustic correlates of roughness and breathiness, H1–H2 reached a pooled effect size of rw = .66 (N = 248) for breathiness, from four studies on different sustained vowels in healthy and pathological speakers (Barsties v. Latoszek et al. 2018). It was one of the twelve measures the authors named as the most promising predictors of breathiness (Barsties v. Latoszek et al. 2018). The ABI development study found almost no relationship in its own data; see Where the sources disagree.

Breathiness, in connected speech. Only one study tested it, with r = −.57 and N = 16, among the single-study measures below the meta-analysis’s .60 threshold (Barsties v. Latoszek et al. 2018). The appendix lists the negative sign without comment.

Pressed and breathy phonation. Toles and Murton recorded 50 vocally healthy adults producing sustained /ɑ/, /i/ and /u/ and an all-voiced sentence in typical, pressed and breathy phonation (Toles and Murton 2025). On the sentence, H1–H2 differed among all three: higher in breathy and lower in pressed phonation, with means of 8.3, 2.3 and 0.6 dB (Toles and Murton 2025). On sustained vowels the picture depends on sex. Women had lower H1–H2 in pressed than in typical phonation, but higher H1–H2 in breathy phonation only on /ɑ/. Men showed no difference between pressed and typical phonation on any vowel (Toles and Murton 2025).

Show the code for this figure
tasks = ["Sentence", "/ɑ/", "/i/", "/u/"]
# Table 2 of Toles & Murton (2025): mean (SD), dB. Order: breathy, typical, pressed.
data = {
    "Women (n = 36)": {
        "Breathy": [(9.0, 5.5), (12.8, 4.4), (14.2, 6.1), (11.5, 4.6)],
        "Typical": [(2.7, 3.9), (8.5, 3.6), (13.3, 5.4), (9.4, 5.5)],
        "Pressed": [(0.8, 3.5), (5.3, 3.1), (8.9, 6.4), (4.5, 6.0)],
    },
    "Men (n = 14)": {
        "Breathy": [(6.4, 3.1), (9.1, 4.1), (7.7, 5.5), (7.4, 3.9)],
        "Typical": [(1.6, 2.6), (4.9, 3.1), (0.1, 3.6), (0.4, 3.5)],
        "Pressed": [(-0.2, 2.2), (4.0, 2.6), (1.0, 5.6), (-0.7, 3.4)],
    },
}
style = {"Breathy": (vs.BLUE, "o", -0.18),
         "Typical": (vs.INK, "s", 0.0),
         "Pressed": (vs.ORANGE, "D", 0.18)}

fig, axes = plt.subplots(1, 2, figsize=(7.4, 3.5), sharey=True)
x = np.arange(len(tasks))
for ax, (panel, groups) in zip(axes, data.items()):
    for cond, rows in groups.items():
        c, m, dx = style[cond]
        mu = np.array([r[0] for r in rows]); sd = np.array([r[1] for r in rows])
        ax.errorbar(x + dx, mu, yerr=sd, fmt=m, ms=5, color=c, ecolor=c,
                    elinewidth=1.0, capsize=2.5, markeredgecolor="white",
                    markeredgewidth=0.6, zorder=3)
    ax.axhline(0, color=vs.MUTED, lw=0.8, zorder=1)
    ax.set_xticks(x, tasks)
    ax.set_xlim(-0.5, len(tasks) - 0.5)
    ax.set_title(panel)
    vs.style_axes(ax)
axes[0].set_ylabel("H1–H2  [dB]")
handles = [Line2D([], [], marker=style[k][1], ls="", ms=5, color=style[k][0],
                  label=k) for k in ("Breathy", "Typical", "Pressed")]
fig.legend(handles=handles, loc="lower center", ncol=3, frameon=False,
           fontsize=8, bbox_to_anchor=(0.5, -0.02))
fig.tight_layout(rect=(0, 0.06, 1, 1))
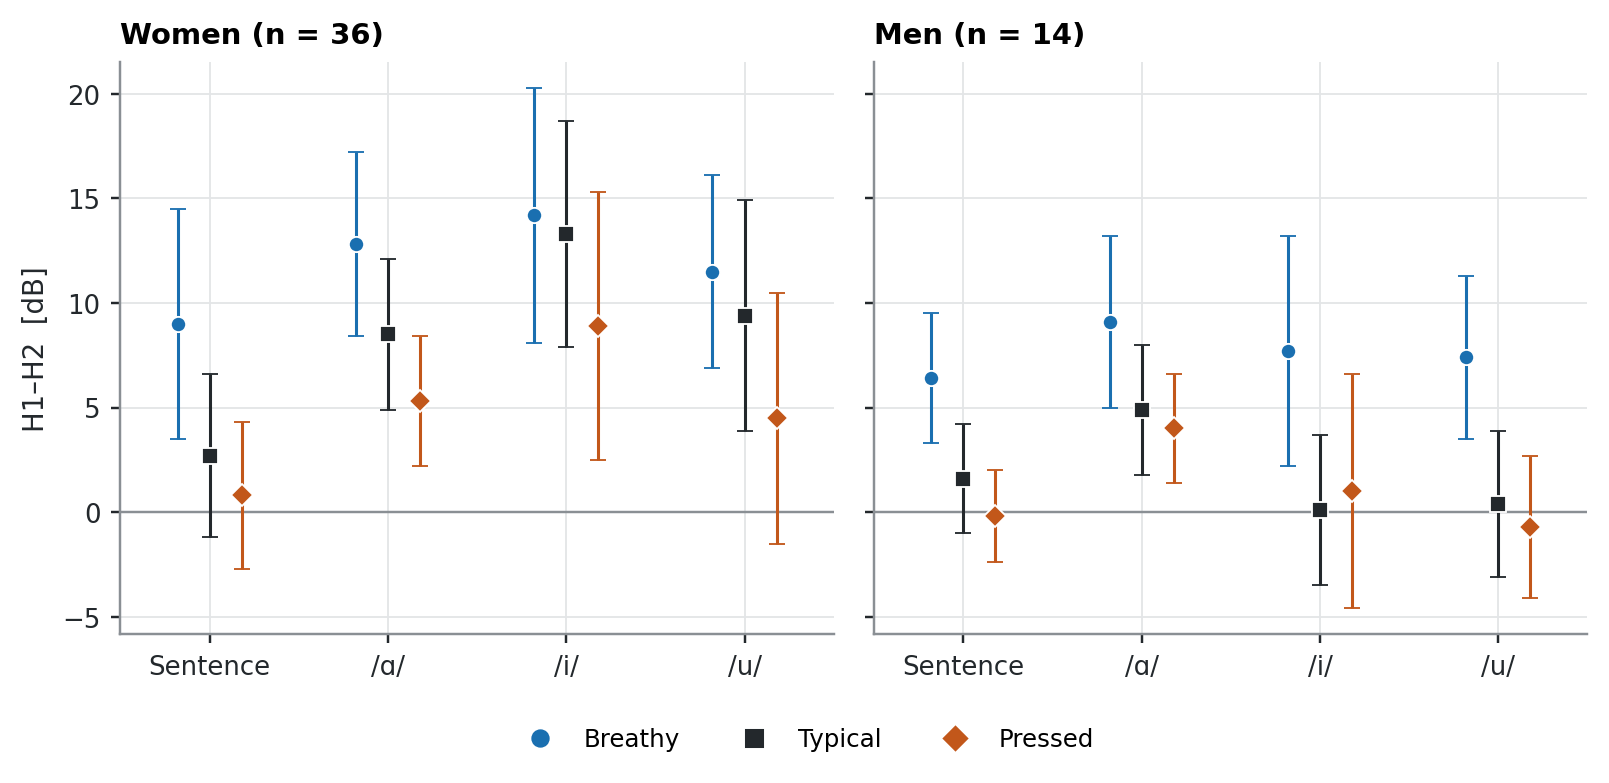
Two panels, women on the left and men on the right. Each shows four tasks on the horizontal axis (sentence, /ɑ/, /i/, /u/) and mean H1–H2 in decibels on the vertical axis, with three markers per task for breathy, typical and pressed phonation and vertical bars for one standard deviation. In the women's panel breathy is highest and pressed lowest on every task. In the men's panel breathy is highest, while typical and pressed nearly coincide on the three vowels.
Figure 12.1: Mean H1–H2 (± 1 SD) by task and phonation type, in 36 women and 14 men (by sex assigned at birth) simulating typical, breathy and pressed phonation. Data from Table 2 of Toles and Murton (2025). In women the means are ordered on every task, breathy highest and pressed lowest, although breathy and typical phonation differed significantly only on /ɑ/. In men, pressed and typical phonation overlap on every sustained vowel and separate only on the sentence. Note also the scale of the sex difference in typical phonation on /i/ and /u/. These are descriptive means from simulated phonation in healthy speakers, computed with a script whose method is not stated: unclassified (pipeline not stated), and not reference values.

Telling the phonation types apart. The study tested discrimination with logistic models at a significance level of 0.0125 (Toles and Murton 2025). H1–H2 separated pressed from typical phonation on /ɑ/ (P = 0.005) and /u/ (P = 0.003), but not on the sentence (P = 0.027) or /i/ (P = 0.103) (Toles and Murton 2025). Its AUCs were 0.62 to 0.75 for pressed against typical phonation, and 0.64 to 0.86 for breathy against typical (Toles and Murton 2025). For breathy phonation, each 1-dB increase in H1–H2 raised the odds of breathy phonation by 11% to 48% across tasks, and intensity did not contribute significantly to those models (Toles and Murton 2025).

Glottal closure, seen directly. A later study from the same group recorded 40 healthy adults with high-speed videoendoscopy while they sustained /i:/ in the three phonation types (Toles et al. 2026). H1–H2 rose with the closing quotient (r = .53), the share of the cycle spent closing, and with the amplitude-to-length ratio (r = .40). It fell as closure became faster and more abrupt: r = −.56 with the normalized maximum area declination rate, −.40 with the speed index and −.61 with the stiffness index (Toles et al. 2026). The relationships with the three closure-speed measures were strong in breathy phonation and small or negligible in pressed phonation; only the closing-quotient relationship held across all three phonation types (Toles et al. 2026). The authors suggest that hyperadduction may introduce nonlinear source–filter interaction that hides the kinematics from the acoustic signal (Toles et al. 2026).

Roughness and strain in a clinical database. In 288 recordings from the Perceptual Voice Qualities Database, H1–H2 entered the best subset for CAPE-V roughness with a coefficient of β = −0.43 and the best subset for CAPE-V strain with β = −0.52 (Lucero 2026). These are coefficients in multivariable regression models, not simple correlations. In a QR factorization with column pivoting, F0 and H1–H2 were pivoted first among 14 parameters, which the paper reads as contributing the most linearly independent information (Lucero 2026). The paper reads the roughness coefficient as irregular vibration producing a flatter spectral envelope (Lucero 2026). That study was written by this reference’s author.

A low value is not specific. Lower H1–H2 accompanies simulated pressed phonation (Toles and Murton 2025), and in the database models it also accompanies higher roughness and higher strain ratings (Lucero 2026). A low H1–H2 on its own does not say which of these is present. That is this reference’s reading of the two sources together, not a finding of either.

12.2.5 Confounds and cautions

Implementation. The variants in Table 12.1 differ in how they locate the harmonics, in spectral resolution and in averaging, and one does not state its method at all. No study in this reference compares H1–H2 across implementations on the same recordings. Do not compare an H1–H2 value with one from another implementation.

Speech task. In the same 50 typical speakers, mean H1–H2 in typical phonation was 2.3 dB on the sentence and 7.5, 9.6 and 6.9 dB on sustained /ɑ/, /i/ and /u/ (Toles and Murton 2025). A value means little without its task.

Sex. On sustained vowels in typical phonation, women’s means were 8.5, 13.3 and 9.4 dB on /ɑ/, /i/ and /u/, against 4.9, 0.1 and 0.4 dB in men (Toles and Murton 2025). On the sentence the two were close, 2.7 and 1.6 dB (Toles and Murton 2025). On vowels the sex difference is as large as the phonation-type effects, so an H1–H2 value read without the speaker’s sex is not interpretable. No source in this reference explains why the difference is so large on /i/ and /u/. For the pressed-phonation effect, Toles and Murton point to the small posterior glottal gap common in women during typical phonation, which pressing can close. Men’s typical phonation usually has complete closure already, so there is less to change (Toles and Murton 2025).

Sign and range. H1–H2 can be negative. Men’s mean on the sentence in pressed phonation was −0.2 dB (Toles and Murton 2025). Across 288 database recordings the mean was 4.20 dB, with SD 6.14 dB and a range from −20.62 to 25.15 dB, which is why it was analysed untransformed (Lucero 2026).

Simulated phonation in healthy speakers. The phonation-type findings come from healthy speakers imitating pressed and breathy voice, and may not generalize to people with voice disorders (Toles et al. 2026). A single blinded voice-specialized speech-language pathologist rated the productions in the 2025 study and identified the nonmodal phonation correctly 96% of the time (Toles and Murton 2025). The 2026 recordings were made during rigid transoral endoscopy, with the posture and tongue position that requires (Toles et al. 2026).

Two studies, probably one cohort. The two Toles studies share a laboratory, an ethics protocol and a recording chain, and report the same enrolment and exclusion counts (Toles and Murton 2025; Toles et al. 2026). They very probably draw on largely the same speakers. They are therefore not independent confirmations of each other. This is this reference’s inference; neither paper states it.

Language. In some languages phonation type is contrastive, and H1–H2 carries the contrast. Breathy vowels in Hmong differ from modal vowels in H1–H2, and laryngealization in Mixtec lowers it (Kreiman and Sidtis 2011). Green Mong vowels can be sorted correctly 92% of the time from H1–H2, duration, F0, jitter and shimmer, with H1–H2 doing most of the work (Kreiman and Sidtis 2011). In such a language a clinical reading of H1–H2 has to allow for the linguistic contrast.

12.2.6 Where the sources disagree

How strongly H1–H2 tracks breathiness. The meta-analysis reports rw = .66 on sustained vowels (Barsties v. Latoszek et al. 2018). In the ABI development study, H1–H2 correlated with breathiness ratings at only rs = 0.098 on 1042 concatenated Dutch speech-and-vowel samples, one of the weakest of the candidate measures (Barsties v. Latoszek et al. 2017). It was kept in the index all the same, on the strength of its earlier record as a breathiness predictor (Barsties v. Latoszek et al. 2017). The two figures differ in task, sample and pipeline, and neither source reconciles them. This chapter reports both.

What the phonation-type study shows. Toles and Murton’s discussion calls H1–H2 the only variable significant for pressed phonation in both sustained vowels and connected speech (Toles and Murton 2025). Their own table gives P = 0.027 on the sentence and P = 0.103 on /i/, against their stated significance level of 0.0125, and their abstract correctly reports that neither measure separated pressed from typical phonation on /i/ (Toles and Murton 2025). This chapter follows the table.

12.2.7 Validation

The perceptual evidence for H1–H2 is the breathiness meta-analysis (Barsties v. Latoszek et al. 2018) and the index development study that included it (Barsties v. Latoszek et al. 2017), and the two disagree about its strength. The physiological evidence is two studies of simulated phonation in healthy adults from one laboratory, one acoustic (Toles and Murton 2025) and one with simultaneous high-speed imaging (Toles et al. 2026). A database analysis places it in the roughness and strain subsets (Lucero 2026). What is still missing is any H1–H2 reference computed with a stated pipeline, and any comparison between implementations. Until one exists, this chapter publishes no H1–H2 normal range.

12.3 Compute it in PhonaLab

Open PhonaLab →

PhonaLab is developed by the author of this reference; see Competing interests.

H1–H2 is computed as a component of the Acoustic Breathiness Index, where the reference value that applies is the ABI cutoff for your language and task. No H1–H2 reference value exists to display beside it.

Barsties v. Latoszek, Ben, Youri Maryn, Ellen Gerrits, and Marc De Bodt. 2017. “The Acoustic Breathiness Index (ABI): A Multivariate Acoustic Model for Breathiness.” Journal of Voice 31 (4): 511.e11–27. https://doi.org/10.1016/j.jvoice.2016.11.017.
Barsties v. Latoszek, Ben, Youri Maryn, Ellen Gerrits, and Marc De Bodt. 2018. “A Meta-Analysis: Acoustic Measurement of Roughness and Breathiness.” Journal of Speech, Language, and Hearing Research 61 (2): 298–323. https://doi.org/10.1044/2017_JSLHR-S-16-0188.
Delgado Hernández, Jonathan, Nieves M. León Gómez, Alejandra Jiménez, Laura M. Izquierdo, and Ben Barsties v. Latoszek. 2018. “Validation of the Acoustic Voice Quality Index Version 03.01 and the Acoustic Breathiness Index in the Spanish Language.” Annals of Otology, Rhinology & Laryngology 127 (5): 317–26. https://doi.org/10.1177/0003489418761096.
Fröhlich, Matthias, Dirk Michaelis, Jan Lessing, Hans Werner Strube, and Eberhard Kruse. 2000. “‘Breathiness Measures’ in Acoustic Voice Analysis.” In Advances in Quantitative Laryngoscopy, Voice and Speech Research: Proceedings of the 4th International Workshop, edited by T. Braunschweig, J. Hanson, P. Schelhorn-Neise, and H. Witte. Jena.
Kreiman, Jody, and Diana Van Lancker Sidtis. 2011. Foundations of Voice Studies: An Interdisciplinary Approach to Voice Production and Perception. Wiley-Blackwell.
Lucero, Jorge C. 2026. “Optimal Acoustic Parameter Subsets for Dimension-Specific Voice Quality Prediction.” Journal of Voice, ahead of print. https://doi.org/10.1016/j.jvoice.2026.07.051.
Toles, Laura E., Avery Moore, Melanie A. Turner Tice, Caroline Crocker Hurt, Rita R. Patel, and Ted Mau. 2026. “Vocal Fold Vibratory Kinematics and Acoustic Correlates in Pressed and Breathy Phonation.” Journal of Speech, Language, and Hearing Research 69: 2417–36. https://doi.org/10.1044/2026_JSLHR-25-00797.
Toles, Laura E., and Olivia Murton. 2025. “Estimating Pressed and Breathy Phonation from Cepstral and Spectral Measures.” Journal of Voice, ahead of print. https://doi.org/10.1016/j.jvoice.2025.02.017.