Living draft. This chapter reflects the sources cited below and will be revised as further sources are incorporated. Found an error? Use the Report an issue link in the sidebar.
Warning
This first version covers the level and variability of F0 in adults. How an F0 track is extracted, and where pitch trackers fail, belongs to the planned F0 Detection chapter in Part I. Children’s F0 and the maximum phonational frequency range will be added in a later release.
6.1 Definition
The fundamental frequency (F0) is the rate at which a waveform repeats. It is measured in hertz (Hz), and the period is its reciprocal, t = 1/F0 (Baken and Orlikoff 2000).
Pitch and frequency are kept separate in this chapter. Pitch is a perceptual attribute, scaled from low to high. Frequency is a physical attribute of the signal. Pitch is not the simple perception of F0: frequency, intensity and spectral properties interact, and perceived pitch can be a poor reflection of F0 (Baken and Orlikoff 2000). That is why the F0 should be measured even when the clinician judges pitch by ear.
Measuring F0 assumes that the signal is at least approximately periodic (Baken and Orlikoff 2000). A voice that is not, a Type 2 or Type 3 signal in the terms of Signal Typing, does not have a dependable F0 to summarise.
Speaking fundamental frequency (SF0) is F0 measured over running speech. This chapter covers SF0 and the F0 of sustained vowels, which, as set out below, are not the same quantity.
6.2 Computation
F0 measures summarise a track of F0 estimates. The ASHA expert panel’s core set for vocal frequency is mean F0, F0 standard deviation, and minimum and maximum F0, all in hertz (Patel et al. 2018).
Table 6.1: F0 summary measures.
Measure
Definition
When it is the right summary
Mean F0
The average of the F0 estimates, taken from windows of equal duration covering the whole signal; or the number of periods divided by their summed duration (Patel et al. 2018)
Mean F0 over a 1-s segment at the lowest modal and the highest (falsetto included) sustainable pitch; the lowest and highest of three trials are reported
Semitones. The semitone difference between two frequencies is
\[
n = 39.86 \, \log_{10}\!\left(\frac{f_2}{f_1}\right),
\]
and doubling a frequency adds 12 semitones (Baken and Orlikoff 2000). A semitone scale with absolute values needs a zero point; Fletcher set 0 ST at 16.35 Hz (Baken and Orlikoff 2000). Semitones make comparisons between speakers simpler, which is why ranges and standard deviations are often reported in them. They do not scale perceived pitch (Baken and Orlikoff 2000).
Task. The ASHA panel takes mean F0 and F0 standard deviation from a reading passage, the first paragraph of the Rainbow Passage for adults. The whole passage is preferred; otherwise a consistently chosen segment at least 5 s long, such as the second and third sentences (Patel et al. 2018). Minimum and maximum F0 come from a pitch glide on /a/ (Patel et al. 2018).
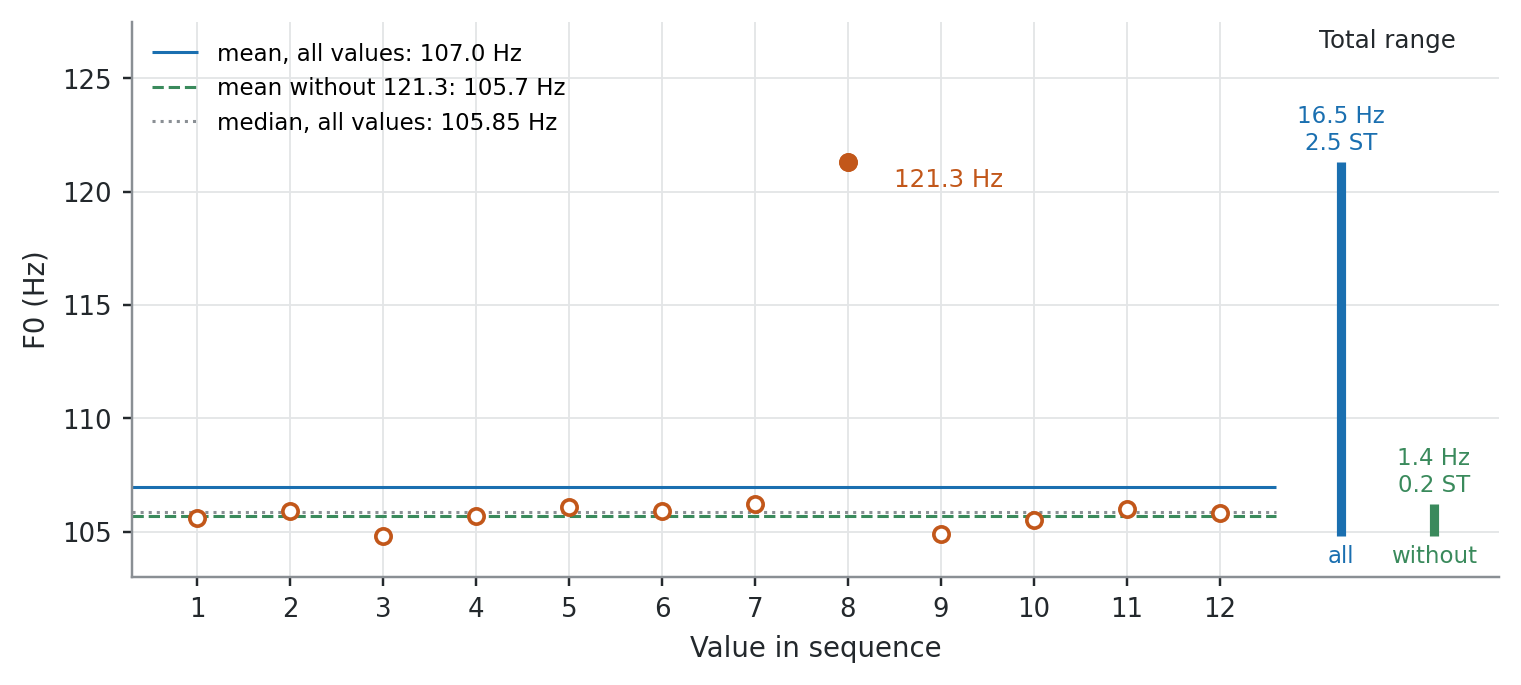
Figure 6.1 uses Baken and Orlikoff’s own worked example to show why the choice of summary matters.
Figure 6.1: Twelve consecutive F0 values from Baken and Orlikoff’s worked example. One reading, 121.3 Hz, stands far from the rest and may be a momentary slip of the larynx or a transient failure of the analysis software. With it, the total range is 16.5 Hz (2.5 semitones) and the mean is pulled up to about 107 Hz. Without it, the range is 1.4 Hz (0.2 semitones) and the mean is 105.7 Hz. The median is 105.85 Hz with it and 105.8 Hz without it. Values from Baken and Orlikoff (2000).
6.3 Normative data
This chapter publishes no diagnostic cutoff for F0. It publishes the reference values below, each with the quantity, task and method it was measured with.
F0 in hertz is a physical quantity. Under the rule set out in Pipeline Dependence and Reference Values, a physical quantity can be compared with a reference that measured the same quantity on the same task with a documented method. For F0 the quantity matters more than it seems. Mean, median and modal F0 are different quantities, and so are the F0 of running speech and the F0 of a sustained vowel.
Every row below is taken from Baken and Orlikoff’s tabulation of older studies, and the primary study is named in the Pipeline cell (Baken and Orlikoff 2000). The methods are documented but mostly analogue: the Fundamental Frequency Indicator, measurement of oscillographic records, an early Visi-Pitch. The primary studies have not themselves been checked for this reference.
Table 6.2: F0 reference values. All rows as tabulated by Baken and Orlikoff (2000), with the primary study named.
Population
Task
Value
Pipeline
Class
Men, 18–25.2 years (n = 100)
Reading, middle 55 words of the Rainbow Passage
Modal SF0: group average 116.65 Hz (34.0 ST); individual modes 85–155 Hz
Running speech, any summary other than those above
No published reference in the sources reviewed
—
—
Any
Diagnostic cutoff for an abnormal F0
No published reference in the sources reviewed
—
—
Three points govern how the table is read.
The two kinds of task do not stand in for each other. The speaking rows are not a reference for the F0 of a sustained vowel, and the sustained-vowel rows are not a reference for speaking F0. See Cautions.
A range of individual modes is not a normal band. The 85–155 Hz and 165–255 Hz ranges in the first two rows record where young adults’ habitual pitch fell while reading. They do not mark a voice outside them as disordered, and they describe the modal F0 of a reading, not the mean F0 of any other task.
Comparing studies needs care. Normative SF0 studies differ in analysis method and in subject selection (Baken and Orlikoff 2000). The table of aged speakers behind the sustained-vowel rows draws mainly on English speakers (Baken and Orlikoff 2000).
6.4 Clinical interpretation
Mean F0 is a weak sign of laryngeal pathology. Most disorders of the larynx do not, in themselves, have a consistent influence on mean SF0 (Baken and Orlikoff 2000). Acute laryngitis lowered SF0 in men and raised it in women in one series (Baken and Orlikoff 2000).
Variability and range follow tissue change more closely, at least for some pathologies (Baken and Orlikoff 2000). Patients with laryngeal cancer had a restricted SF0 range on the second sentence of the Rainbow Passage (Baken and Orlikoff 2000). In Murry’s series, men with unilateral vocal fold paralysis had a significantly smaller F0 standard deviation (3.64 ST) and range (7.55 ST) than normal men (4.63 ST and 10.60 ST) (Baken and Orlikoff 2000).
F0 changes across the life span. In early childhood the sexes have comparable SF0. Adult women generally have a higher SF0 than men. SF0 falls with maturity and tends to rise again in old age, and the rise is greater and earlier in men (Baken and Orlikoff 2000).
Not every F0 track is described by its mean and SD. A steady fall in F0 needs the slope of a regression line. A regular oscillation, such as tremor, needs its mean, its extent and its rate (Baken and Orlikoff 2000).
6.5 Cautions
Sustained vowel against speech. Baken and Orlikoff advise against estimating SF0 from a sustained vowel. The relationship of sustained-vowel F0 to SF0 is “at the very best, unclear and probably unstable” (Baken and Orlikoff 2000).
Reading against spontaneous speech. Mean SF0 in reading was slightly higher than in spontaneous speech, by 0.47 to 1.78 ST across studies, with no large difference in variability (Baken and Orlikoff 2000).
Sample length. About 14 s of speech gives a mean SF0 accurate to about ±3 Hz, and a single sentence is too short to estimate F0 variability (Baken and Orlikoff 2000).
Intensity. Louder speech tends to be at a higher F0, so testing should be done at a standard intensity where possible (Baken and Orlikoff 2000).
Trial-to-trial variation. A speaker’s F0 varies from trial to trial, on the same day and across days, so a measured change needs caution (Baken and Orlikoff 2000).
Outliers. One spurious value can inflate the total range many times over (Figure 6.1) (Baken and Orlikoff 2000). A tracking error is exactly such a value, which is one reason to inspect the F0 track before reporting any summary of it.
PhonaLab is developed by the author of this reference; see Competing interests.
PhonaLab’s Pitch Visualizer shows the F0 track of a recording with its summary statistics. The values in Table 6.2 describe the task and the summary they were measured with; compare a PhonaLab value with a row only when the task and the summary match.
Baken, Ronald J., and Robert F. Orlikoff. 2000. Clinical Measurement of Speech and Voice. 2nd ed. Singular Thomson Learning.
Patel, Rita R., Shaheen N. Awan, Julie Barkmeier-Kraemer, et al. 2018. “Recommended Protocols for Instrumental Assessment of Voice: AmericanSpeech-Language-HearingAssociation Expert Panel to Develop a Protocol for Instrumental Assessment of Vocal Function.”American Journal of Speech-Language Pathology 27 (3): 887–905. https://doi.org/10.1044/2018_AJSLP-17-0009.